Any market.Your area ofoperations.
227 columns of demographic, economic, and market data — from State to Tract. Exportable to Excel.
Built by an Investor, for Investors.
Travis County, TX
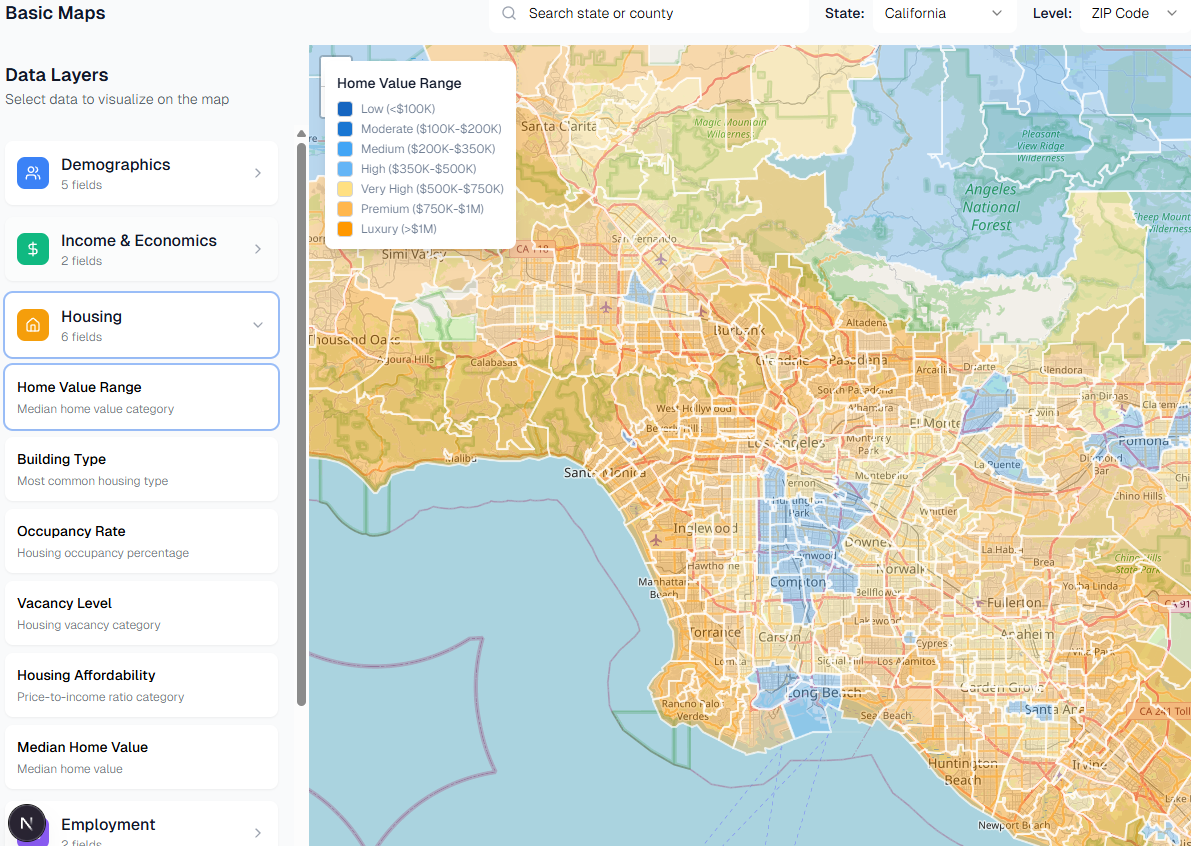
Housing
- Median Home Value
- Ownership Rate
- Rent by Bedroom
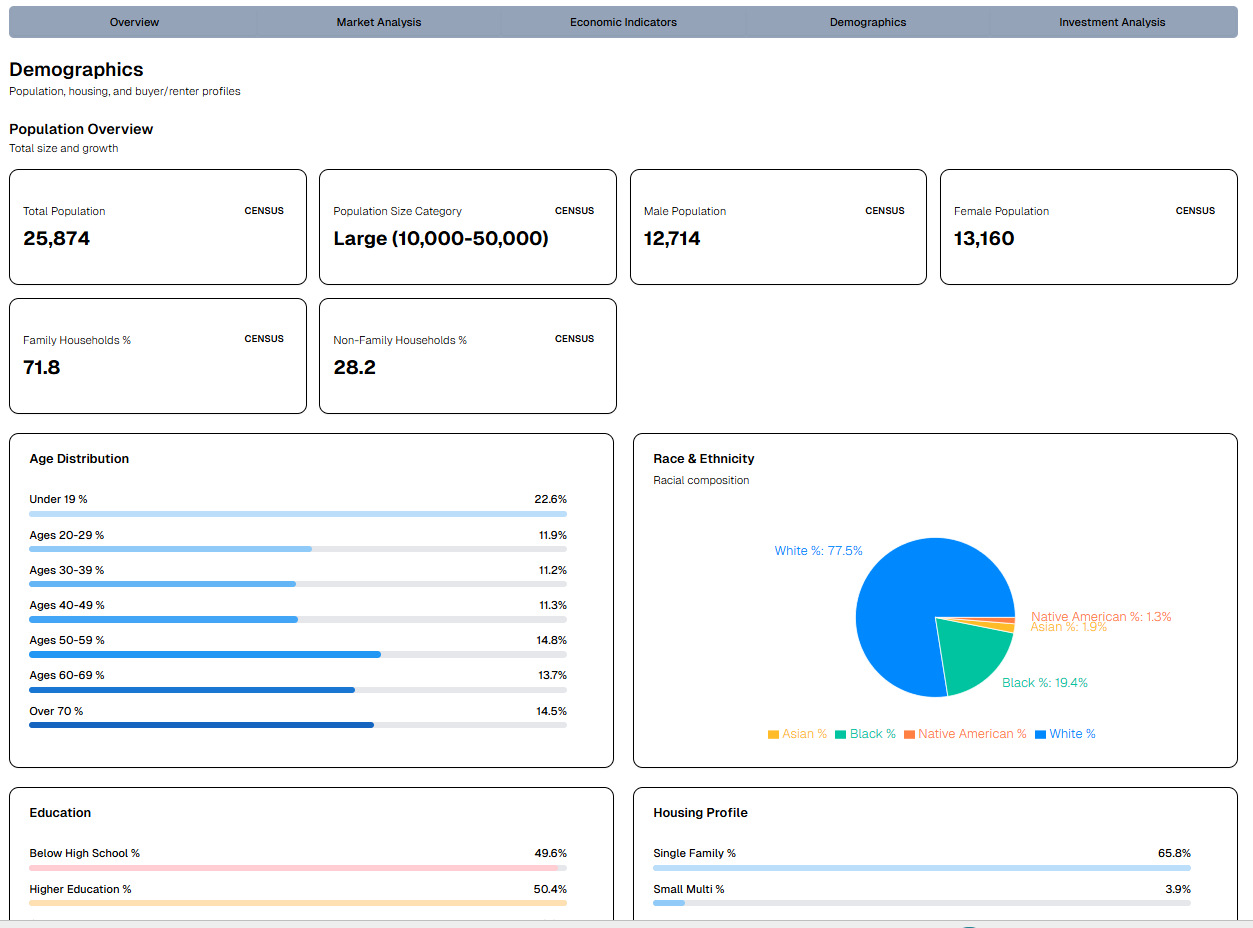
Demographics
- Age Distribution
- Race & Ethnicity
- Population
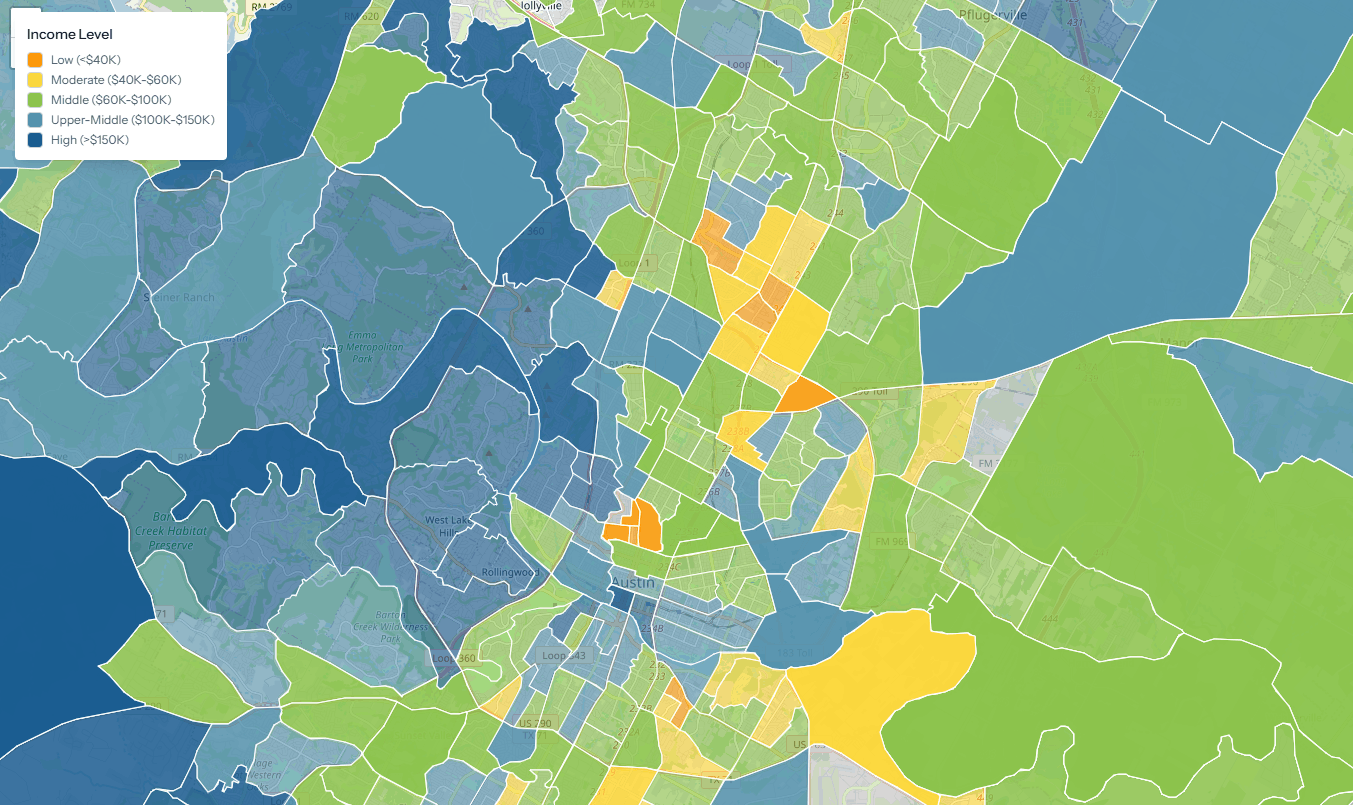
Economic
- Income Distribution
- Unemployment Rate
- GDP by County
Returns
- Investment Metrics
- Cap Rate
- Utility Expenses
Rankings
- County & ZIP Scoring
- Neal Bawa Framework
- Realtor.com hotness
227 columns total · Census · FRED · Redfin · Realtor.com · State to Tract
See What Locals Can't
Locals know the vibe. You have the data.
Combine both and invest like you lived there.
State to tract.
Every level covered.
From statewide economic trends down to individual census tracts — the same 227-column dataset, available at every geographic level.
Travis County, TX
Before you book the flight.
Before you hire the consultant.
Before you build the spreadsheet.
Every market. Every level.
State overview
Macro Signals, Population Shifts, Economic Health
County deep-dive
Employment, Income, Housing Supply & Demand
ZIP-level signal
Demographics, Housing Statistics, Income Distribution
Tract granularity
Economics Signals, Demographics Distribution, Housing Stats
Know before you commit to any of these.
Know if the market is worth your time before any of this starts. That's it. That's the whole thing.
siftAO gives you the market context to move forward with conviction — or walk away before it costs you.
Three steps.
No guesswork.
01
Sift
Filter 2,859 counties by income growth, permit velocity, vacancy, and HPI — ranked by the Bawa framework.
02
Analyze
Pull 227 columns of Census, FRED, and Redfin data for any market. Export to your underwriting model.
03
Operate
Know your market before you commit capital. Make the call with data, not intuition.
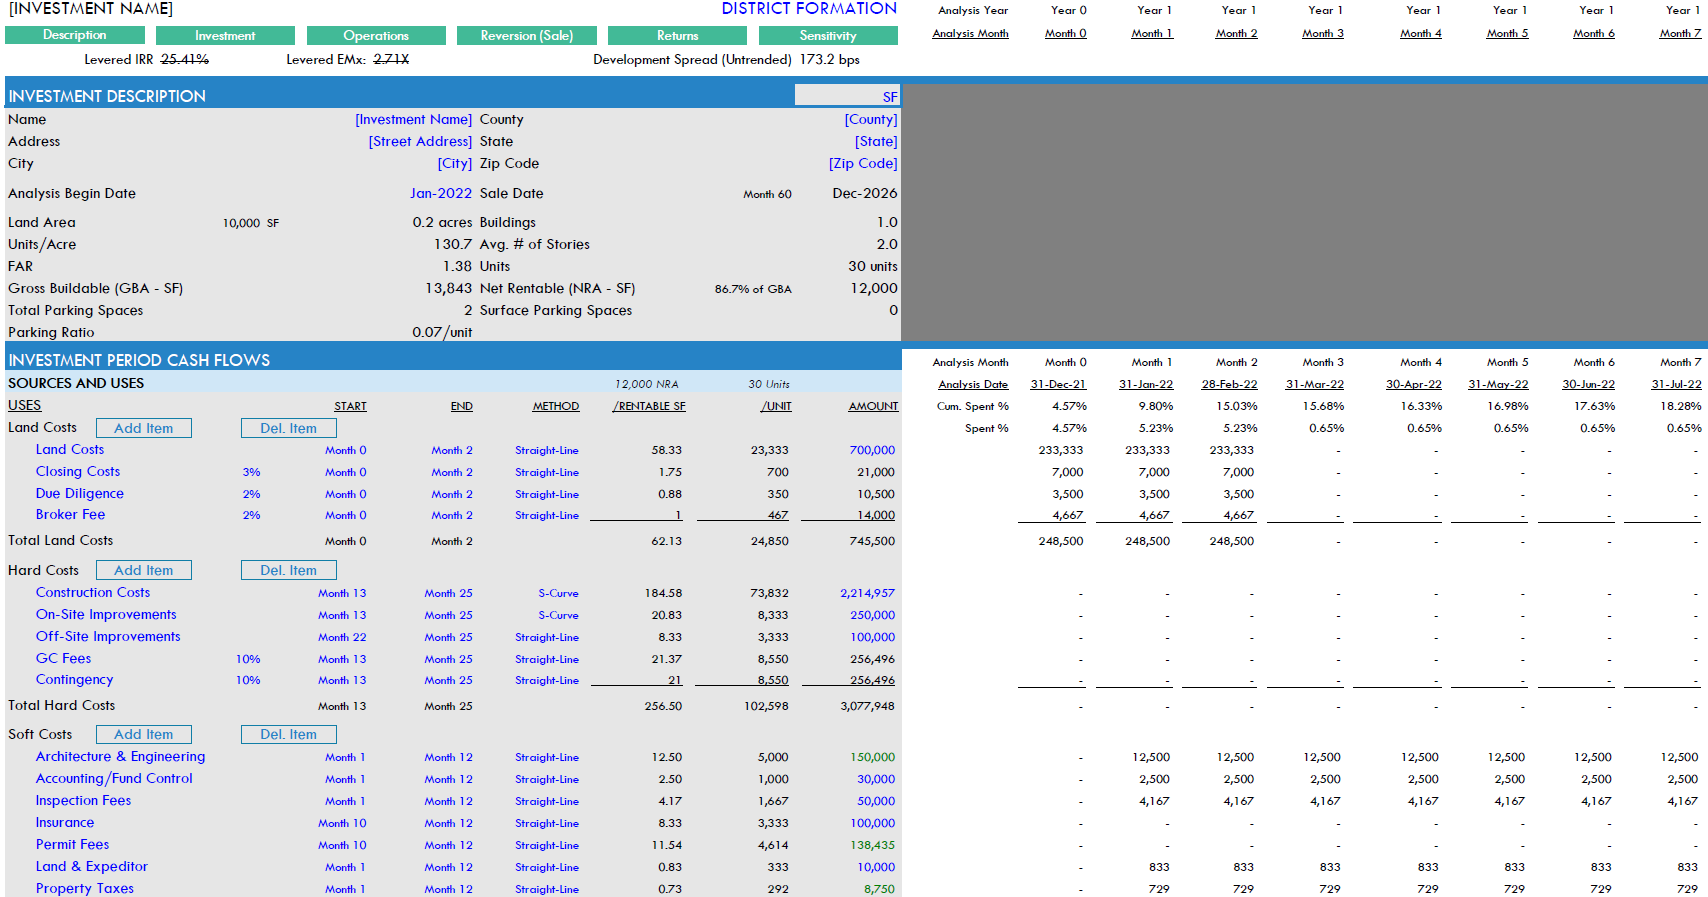
Your data,
Your model.
Extract over 227-column dataset into your own underwriting model. Our Excel templates give you the structure — you bring the market.